SMA 50
What it is: Same calculation as SMA 20, but over 50 periods.
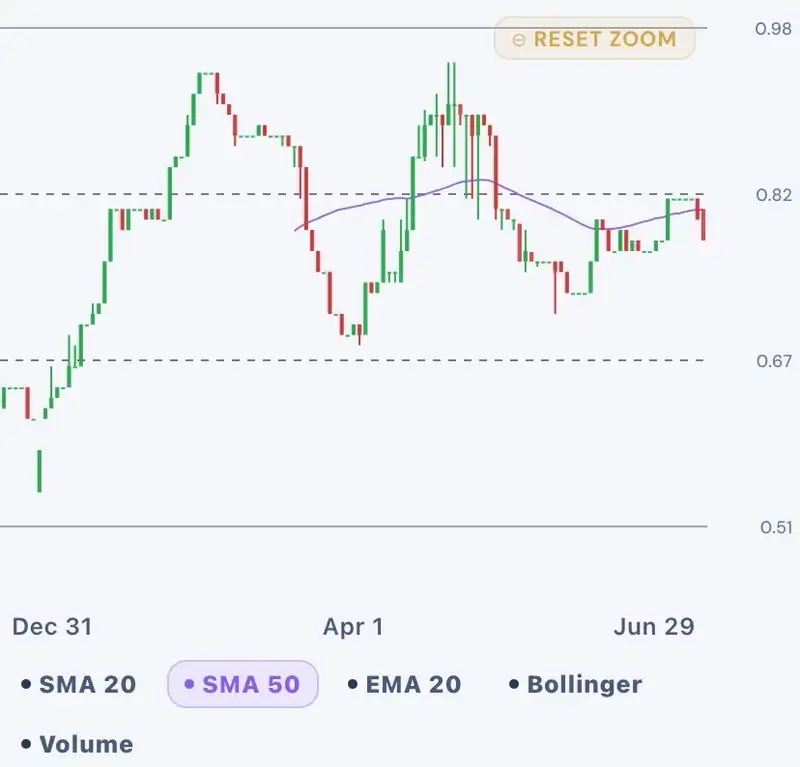
What it tells you: Medium-term trend. Averages more data, so slower and less noisy than SMA 20.
How to read it: SMA 20 crossing above SMA 50 = “golden cross” (bullish). Crossing below = “death cross” (bearish). These lag price — they confirm a trend already underway, not predict it.
3 likes
0 comments
257 views
Join the conversation on Wallflake
Connect with thousands of Ghana Stock Exchange investors. Share insights, discuss stocks, and grow your portfolio together.
Download the App — Free