SMA 20
SMA 20= Simple Moving Average over 20 periods. Add up the closing prices of the last 20 candles, divide by 20.
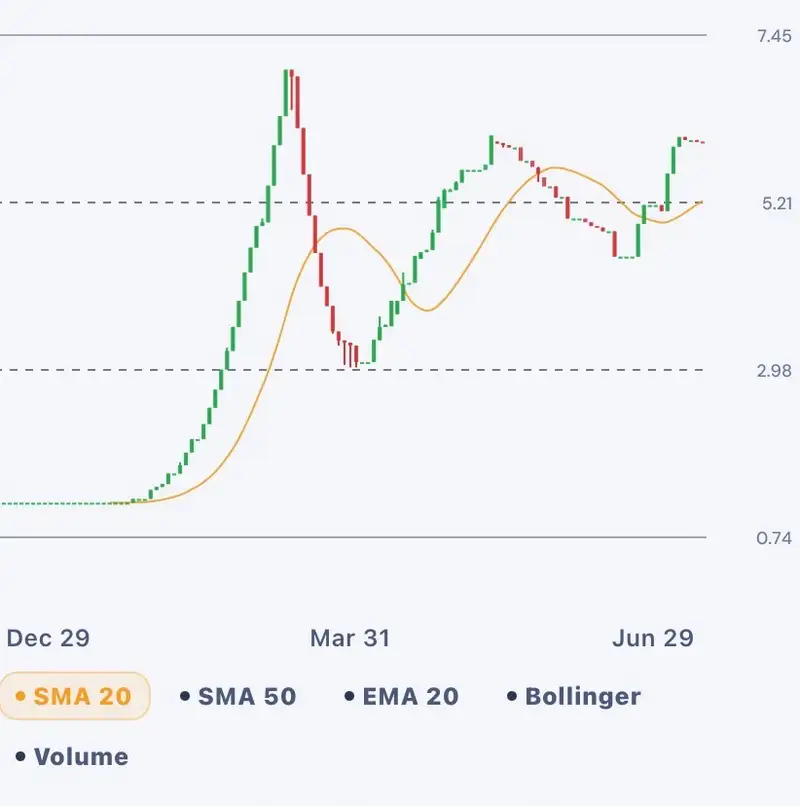
What it tells you: The average price over the last 20 sessions. It smooths out daily noise so you can see the short-term trend without overreacting to one wild candle.
How to read it: Price above SMA 20=short-term bullish bias. Price below=short-term bearish bias. It reacts faster than longer averages (like SMA 50) because it only looks at recent data —good for spotting early s
1 likes
0 comments
188 views
Join the conversation on Wallflake
Connect with thousands of Ghana Stock Exchange investors. Share insights, discuss stocks, and grow your portfolio together.
Download the App — Free