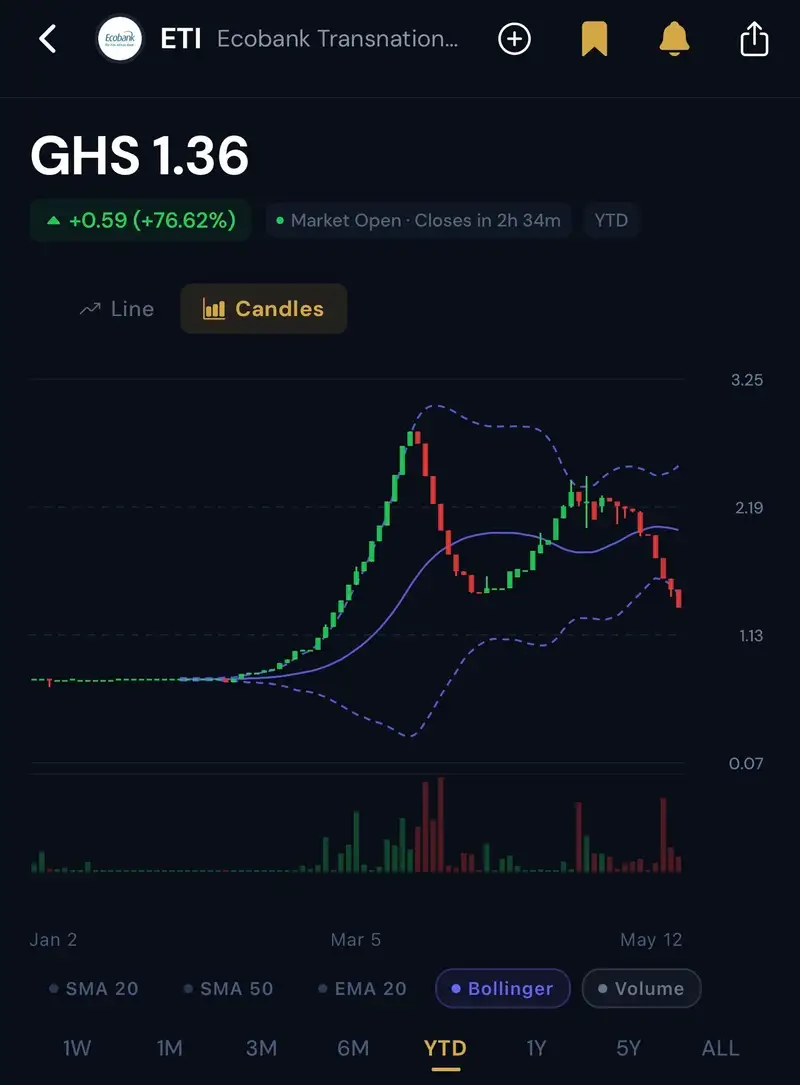
₵ETI breaks resistance, now trading near the lower Bollinger Band at GHS 1.36. Lower Bollinger touches can indicate oversold conditions, but during a strong downtrends, price can continue hugging the lower band. So this is not automatically a “buy signal” yet. Let me know what u think. Buy or Hold?
22 likes
9 comments
1451 views
Join the conversation on Wallflake
Connect with thousands of Ghana Stock Exchange investors. Share insights, discuss stocks, and grow your portfolio together.
Download the App — Free